GET INSIGHTS TO IGNITE YOUR GROWTH
Turtl dashboards and automated reports reveal detailed insights to improve your content, inform sales conversations, and close more deals.
Trusted by hundreds of companies worldwide
ALL YOUR BUYER SIGNALS. ONE CLEAR STORY.
Go beyond basic metrics. Turtl Analytics delivers real-time, actionable insights powered by 1,251 behavioral signals - so you can track engagement, optimize performance, and prove revenue impact.
REAL-TIME INSIGHTS TO OPTIMIZE QUICKLY
Use Turtl’s Revenue AI agent, Hatch, to see what’s working, uncover opportunities, and make smarter content decisions throughout the buyer journey.

Create content that performs
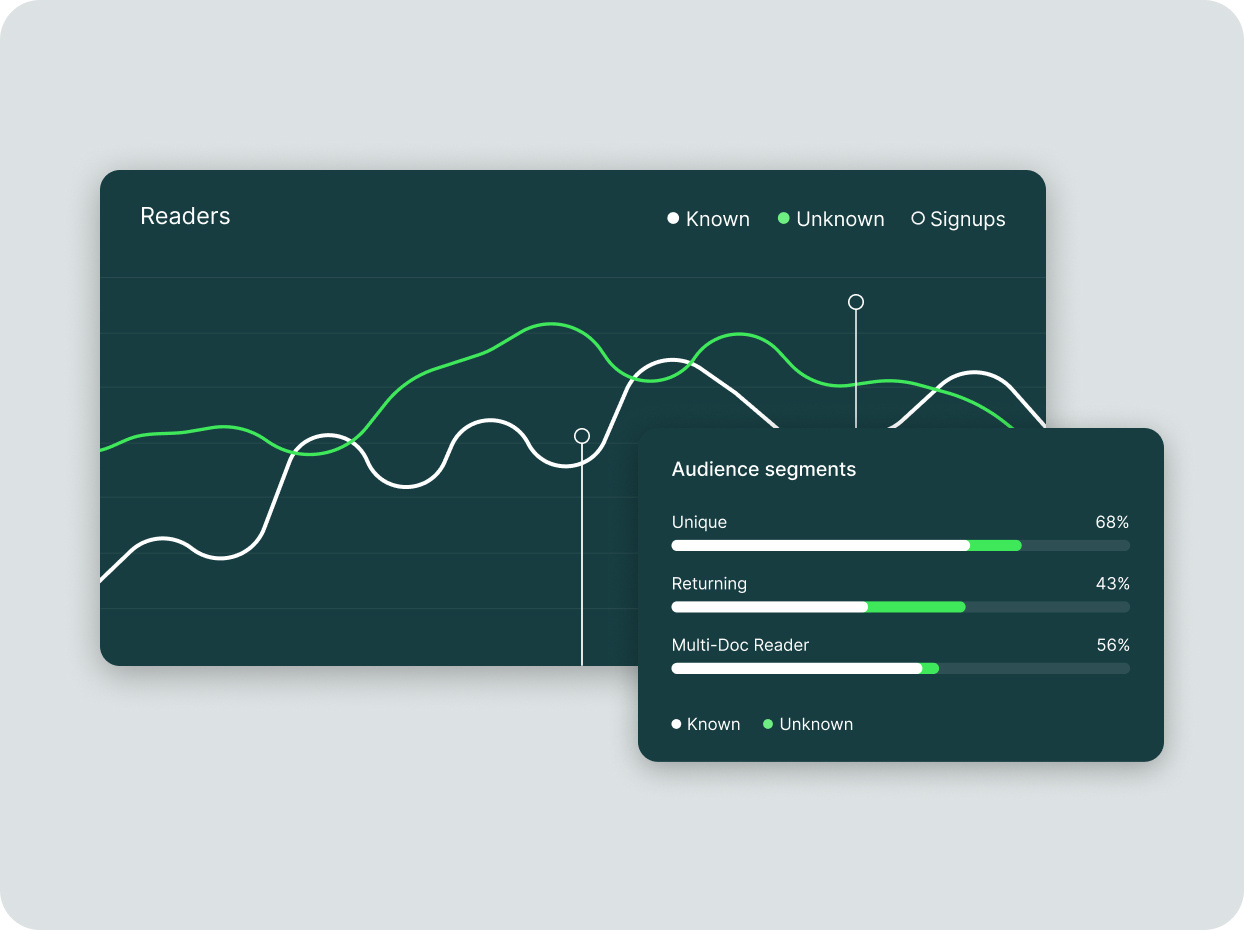
Track engagement across every piece of content to spot what resonates, and use AI to optimize your content to warm, convert, and retain more buyers.

Understand reader intent
Get to know your audience through every click, scroll, and interaction - so you can act with confidence at every step.

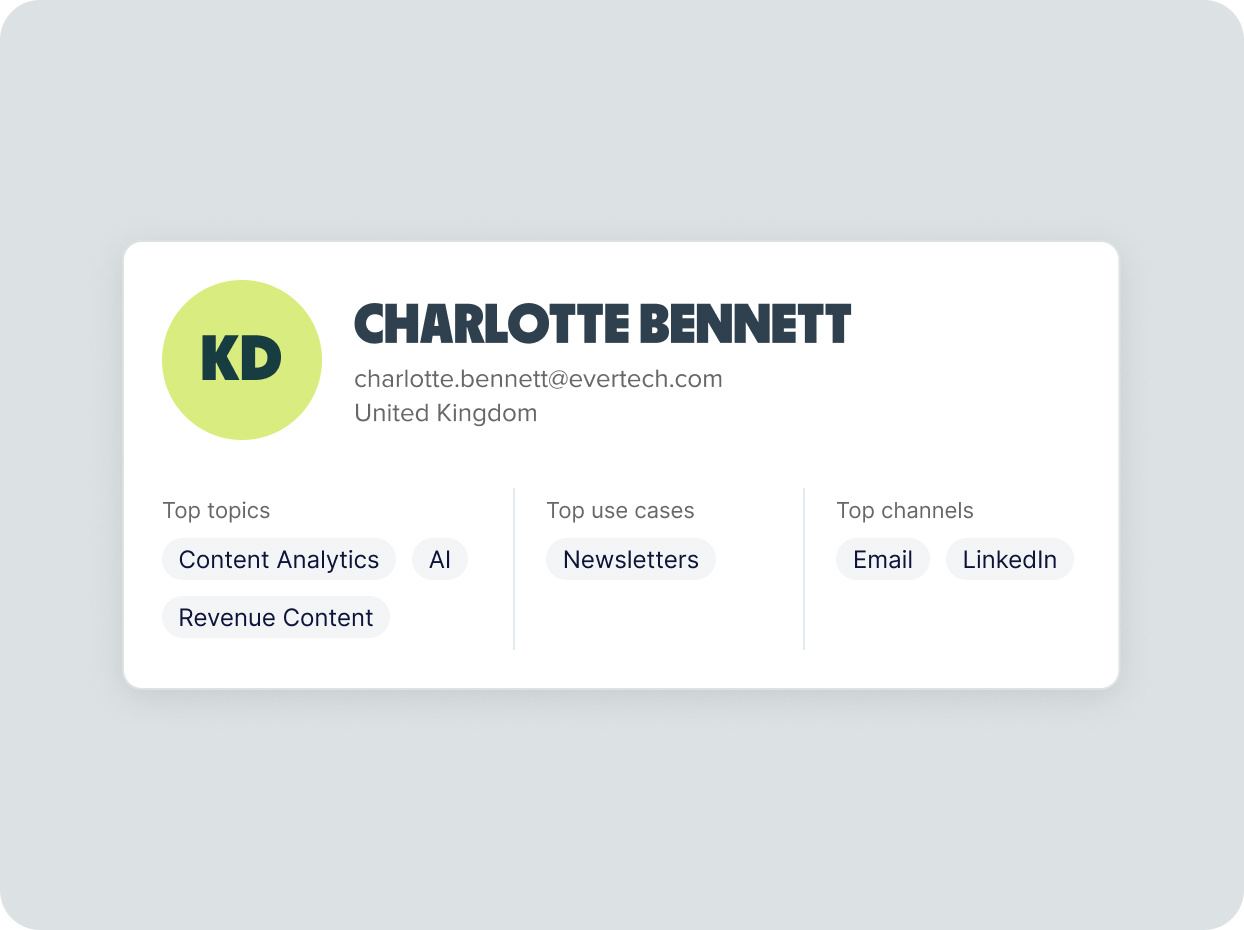
Turn data into deal fuel
Track how known readers engage with your content. Uncover interests, trigger smart follow-ups, and give sales the insight they need to close deals faster.

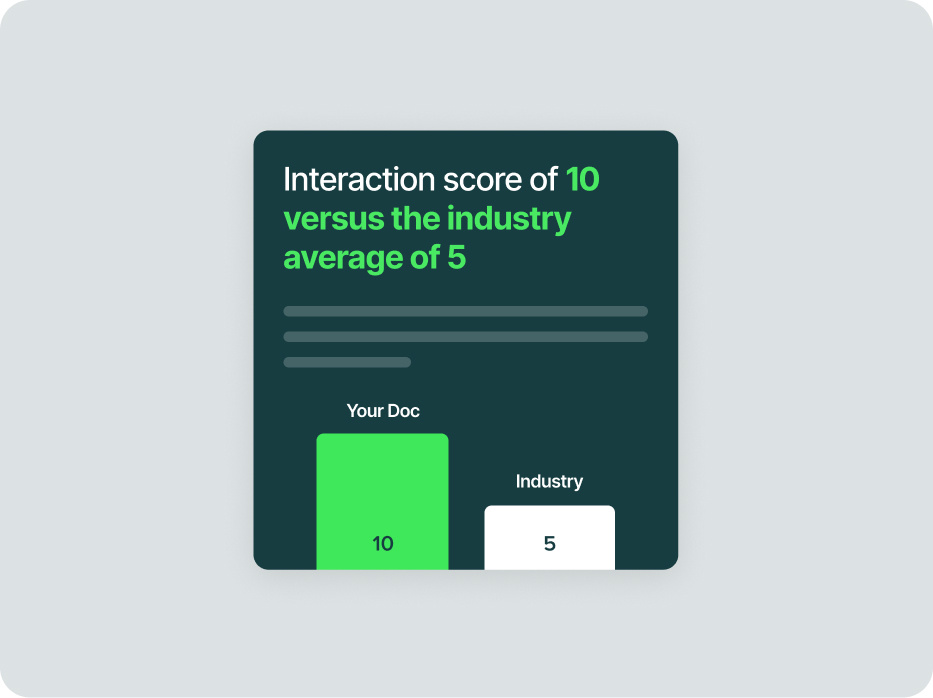
Compare performance against industry peers
Tap into 35B+ data points to see how your content really measures up. Turtl benchmarks reveal how you stack up against your industry and peers, highlighting where you’re winning, where you’re falling behind, and what to do to stay ahead.
TURN INSIGHTS INTO ACTION WITH CONTENT ANALYTICS
Set content objectives
Before you create your new Turtl Doc, outline some clear goals or objectives. What does this content need to achieve? It could be raising brand awareness, generating leads, or driving sales.
Select KPIs
Now that you’ve defined your primary objectives, it’s time to pick relevant, related key metrics. Maybe it’s average read time, sign-ups, shares, or bounce rate.
Turn data into action
Look at the data through the lens of your chosen objectives and metrics. Which sections of your content performed really well? Are there any patterns in topics, interactions, or layouts?
Stay ahead of the pack
Zooming out to see how your content compares to what else is on the market can be invaluable. Making sure your content hits the mark for your target audience will propel you towards your goals.
Identify optimizations
You might need to switch topics, shake up layouts, add more interactivity, or focus on different channels. Your recommendations should be specific, measurable, and achievable.
Drive better content performance
With Turtl Analytics, you can see what’s working, tweak what’s not, and turn insights into action, so every piece performs better. Keep track of what you learn, make smarter moves, and watch your revenue grow.
HOW CUSTOMERS WIN WITH CONTENT ANALYTICS
Less guesswork, more wins. Turtl helps B2B marketers know what drives impact - so they can do more of what works.
550%
increase in marketing-attributed revenue
Revenue-driven content unlocks marketing opportunities, as Kantar saw with their increased focus on content since adopting Turtl.
WHAT OUR CUSTOMERS SAY
Turtl allows our Content team to have access to detailed content consumption data. We can measure how our content is performing, the topics of interest to our audiences and how we’re influencing sales. This is crucial for us as we’re now able to build our content plans based on strategic data and insights, in addition to other KPIs from the Marketing and Campaign teams. A real game changer for us in a complex environment!
 Laetitia Catta
Head of Content Marketing, Cegid
Not only is it content marketing, but it really is the metrics and trackability to really be able to provide impact to our business.
 JeeYoung Wenglikowski
Senior Global Marketing Manager, KellyOCG
Through Turtl we can easily identify new revenue opportunities and leads which are then passed to our sales team. This provides tangible ROI and clear visibility over what impact content is having on the bottom line.
 Lauren Fitzgerald
Senior Strategist, Nielsen
We’ve found the tool is very good for ABM, at gathering high-quality leads, and showing our customers that we understand them.
 Jordan Kologe
Senior Product Marketing Manager, Veeva
We produced a record level of sales opportunities while also learning that we have incredibly engaged prospects in geographical regions we have yet to even focus on! Information like this is invaluable across our sales function.
 Liam McGrory
Marketing Director, Willis Towers Watson
With this further integration, we can see at a more granular level how they're interacting and it's moving people through the funnel a lot quicker because we are able to see how many interactions they're actually having.
 Russell Webb
Marketing Campaigns Manager, Peoplesafe
FAQS
How does Turtl measure content performance beyond traditional engagement metrics?
Turtl captures 1,251 behavioral signals per session, providing deep insights into how your audience interacts with your content. Instead of just clicks and downloads, Turtl tracks read time, chapter engagement, and drop-off points to help marketers optimize content for conversions and revenue impact.
How does the Turtl format improve engagement?
By using an immersive, digital format packed with interactive elements like video, audio, quizzes, and animations, Turtl keeps readers hooked 10x longer than PDFs, so your content works harder and converts better.
Can Turtl show the direct impact of content on revenue?
Yes, Turtl connects content engagement data to pipeline and revenue impact, helping marketers prove ROI. Its analytics dashboard provides insights into which assets drive influence and source pipeline, and accelerate deal velocity and win rates, allowing teams to optimize investments.
Does Turtl integrate with CRMs and marketing automation platforms?
Absolutely. Turtl integrates deeply with Salesforce, HubSpot, Marketo, and other systems, allowing businesses to sync content engagement data with lead scoring, sales follow-ups, and personalized outreach efforts. This ensures marketing and sales alignment for better conversion rates.
What makes Turtl’s analytics different from other content platforms?
Unlike traditional content platforms that focus on basic engagement metrics (e.g., clicks, page views), Turtl provides structured, actionable insights. It surfaces audience intent signals, enables A/B testing, and offers AI-driven content optimization recommendations to maximize pipeline and revenue.
How can sales teams use Turtl’s analytics to close deals faster?
Turtl’s analytics help sales teams identify high-intent prospects by tracking individual engagement with sales collateral, proposals, and product overviews. Reps can see exactly which sections resonate most and use these insights to personalize follow-ups, improving win rates and deal velocity.
Can Turtl provide benchmarks to compare content performance?
Yes, Turtl allows you to compare your content’s performance against industry and top performance benchmarks from over 400 enterprises. With insights gathered from billions of data points, Turtl provides contextual performance comparisons, helping you understand how your engagement rates, read times, and conversion metrics stack up against similar companies. This enables you to refine your strategy and optimize content for maximum revenue impact.
Turn insights into revenue
Schedule a demo with a Turtl expert to find out more about creating and optimizing your content for real business impact.
MORE ABOUT TURTL
OVER 85% WIN RATE ON PROPOSALS
Read how Peoplesafe got to a staggering 85% win rate on bids and proposals with Turtl.
TIPS TO DRIVE CONVERSIONS
Make your content a powerful conversion tool with these 11 data-driven tips.
550% INCREASE IN REVENUE
See how Kantar achieved an incredible 5x increase in marketing attributed revenue and a 250% increase in conversion.
CONTENT MARKETING ROI
Discover how to measure content ROI and prove its impact before the C-suite comes knocking.
