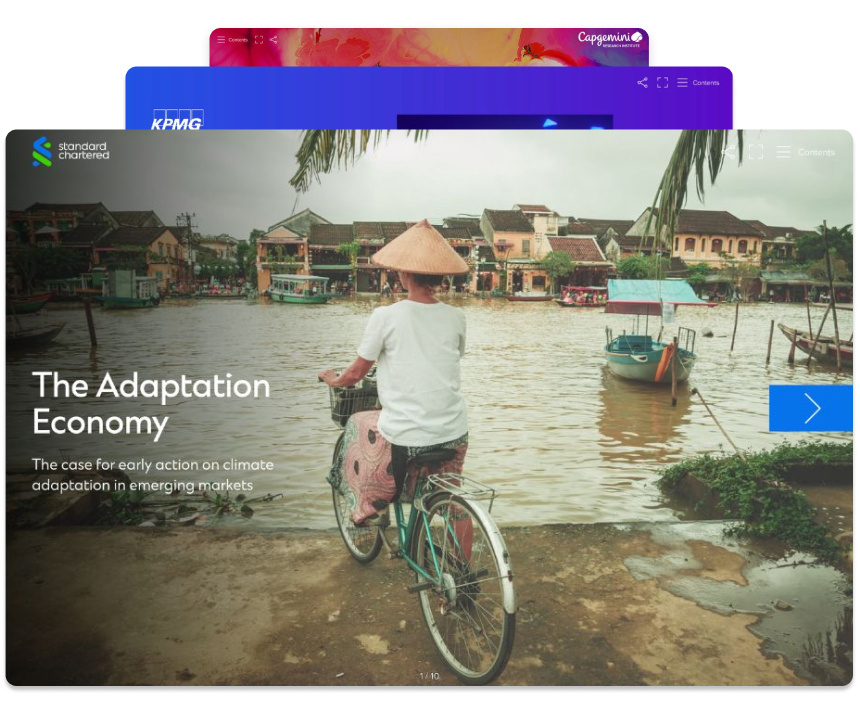
DRIVE MORE PIPELINE WITH DIGITAL REPORTS
Visualize your data, convey your findings, and demonstrate your expertise with interactive reports that win more attention, engagement and conversion.
Trusted by hundreds of companies worldwide

SIMPLIFY THE COMPLEX WITH DIGITAL REPORTS
Create, personalize, and optimize your digital reports showcasing your expertise to boost your content revenue.
-
Capture readers’ attention and improve information recall
-
Produce digital reports 90% faster
-
Ensure data is always accurate with real-time editing
-
Generate high-intent leads
-
Track reader analytics and topic engagement to enhance your CRM
-
Gain insights to improve the performance of your reports
-
Receive optimization recommendations to drive more pipeline
ENGAGE PROSPECTS WITH
INTERACTIVE REPORTS
Create demand
Develop compelling and credible top of funnel reports, with dynamic charts, graphs and polls
Always on-brand
From annual to trend, or sustainability reports, create brand themes with colors, fonts and flourishes
Capture and nurture leads
Use reports as lead magnets with flexible gating, lead scoring triggers, and reader-level insights
TURN REPORTS INTO REVENUE
567%
increase in MQLs
Using revenue content empowered brands to scale their outcomes. With Turtl, Redstor generated a 567% increase in MQLs in just six months.
EXPLORE OUR REPORT TEMPLATE →
Turn raw data into actionable insights. Explore interactive elements (think polls, videos, charts and more!) to make complex information easy to interpret. Ready to make your data shine? Create scalable on-brand assets in minutes.
WHAT TYPES OF REPORTS CAN YOU CREATE?
Research reports
Research reports cover a specific topic or area of research you’re engaged in. Their content can vary considerably between lots of data to extensively detailed written content.
Turtl Tip: Research reports may require the use of various forms of media, Turtl’s video and audio widgets are perfect for recordings of your research.
Industry reports
Industry reports provide extensive overviews of particular industries and with the level of in-depth information they contain, businesses need to be able to see a clear picture of all the finer points from emerging trends and market shares to supply and demand chains.
Turtl Tip: Use the extensive range of engaging widgets like graphs and imagery to enhance your digital industry report.
Annual reports
Visualize complex data with interactive charts and graphs. Present complex long-form content in a digestible format.
Turtl Tip: Forgetting figures is one thing, losing them is another. With Turtl’s Title and Chapter sections you can easily find the relevant information without having to scroll.
CSR reports
Organizations create and share ESG reports to document their environmental, social, and governance practices and performance. These reports help stakeholders to understand an organization’s commitment to sustainable and ethical practices, and are intended to provide transparency and accountability.
Turtl tip: Short explainer videos are a great way to communicate ESG initiatives. Why not include interviews with stakeholders or community members to bring a much-needed human element to your content?
ESG reports
Organizations create and share ESG reports to document their environmental, social, and governance practices and performance. These reports help stakeholders to understand an organization’s commitment to sustainable and ethical practices, and are intended to provide transparency and accountability.
Turtl tip: Short explainer videos are a great way to communicate ESG initiatives. Why not include interviews with stakeholders or community members to bring a much-needed human element to your content?

WHAT OUR CUSTOMERS SAY
The biggest learning Turtl gives us - what content our audience is actually engaging with, where they drop off, what drives conversion and help us drive more revenue from our content.
 Jane Ha
Senior Marketing Manager, Kantar Worldpanel
Through Turtl we can easily identify new revenue opportunities and leads which are then passed to our sales team. This provides tangible ROI and clear visibility over what impact content is having on the bottom line.
 Lauren Fitzgerald
Senior Strategist, Nielsen
We produced a record level of sales opportunities while also learning that we have incredibly engaged prospects in geographical regions we have yet to even focus on! Information like this is invaluable across our sales function.
 Liam McGrory
Marketing Director, Willis Towers Watson
Turtl allows our Content team to have access to detailed content consumption data. We can measure how our content is performing, the topics of interest to our audiences and how we’re influencing sales. This is crucial for us as we’re now able to build our content plans based on strategic data and insights, in addition to other KPIs from the Marketing and Campaign teams. A real game changer for us in a complex environment!
 Laetitia Catta
Head of Content Marketing, Cegid
Turtl has been an extremely vital tool for the ABM team at Jabra…Using Turtl's personalisation Engine, we are now able to generate highly engaging, customized customer-facing documentation in minutes, rather than hours. We have seen the amount of time it takes to deliver a piece of content decrease by about 80-90%, giving us time to focus on delivering additional value to our account teams and customers.
 Jamie King
Account Based Marketing Manager, Jabra
TURN YOUR CONTENT INTO DOLLARS
MORE ABOUT TURTL
OVER 85% WIN RATE ON PROPOSALS
Read how Peoplesafe got to a staggering 85% win rate on bids and proposals with Turtl.
CLOSE THE REVENUE GAP
Discover how to solve the biggest problem impacting your marketing performance and pipeline.
550% INCREASE IN REVENUE
See how Kantar achieved an incredible 5x increase in marketing attributed revenue and a 250% increase in conversion.
WHAT IS REVENUE CONTENT?
Learn how to build a bridge between your marketing and return on investment.
